
こんにちは、せーじんです。
今日は米国の11あるセクターの1つ、公益事業セクターについてお話をしますよ。
公益事業セクターは英語で「ユーティリティセクター」といいます。

公益事業セクター?市役所とか?

市役所は株式会社じゃないでしょw

電気、水道、ガスね。確かに公益っぽいわ
公益事業セクターの市場規模を確認しましょう。
こういう時は、S&P500のセクター別構成比を確認するとわかりやすいですよ。
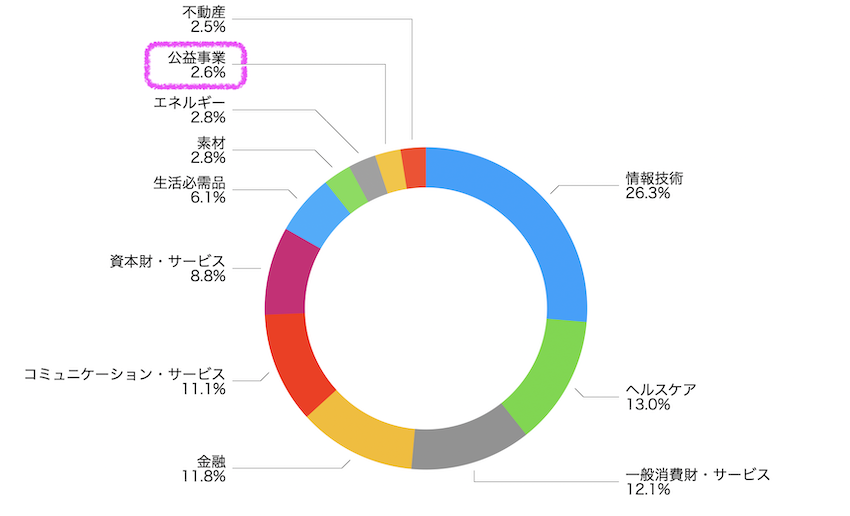
公益事業の割合は2.6%で、11業種中10番目。
かなり規模の小さいセクターなんだね


公益事業セクターは高成長と不況への強さを併せ持ったセクター
公益事業セクターは、どんな値動きをするの?
このセクターの特徴は、高い配当と不景気への強さを併せ持っているということだね
公益事業セクターの提供する製品やサービスは、
電気、水、ガスなど
いずれも生きていくために欠かせないものですよね。
不景気だからといって、需要がなくなってしまうものではないんです
逆に景気がよくても、極端に需要が増えるモノでもないですね
そうだねえ
公益事業は、景気に左右されにくい安定したセクターなんです。
景気の波の影響をモロに受ける、景気敏感セクターとしては、
資本財セクターや素材セクターがあります。
詳しくはこちらで紹介しましたので、ぜひご覧ください。


今回登場するETFは、この2つ
公益事業ETFって、どんなのがあるの?
今日登場するのは、この2つのETFだよ
- バンガード 米国公益事業 セクターETF (VPU)
- 公益事業 セレクト セクター SPDR ファンド (XLU)
それでは、一覧表にしてみてみましょう!
| ティッカー | VPU | XLU |
|---|---|---|
| 運用会社 | バンガード | ステートストリート |
| 設定日 | 2004.1.30 | 1998.12.16 |
| 総資産 | 47億5500万ドル | 117億3500万ドル |
| 出来高 | 126,436 | 10,742,140 |
| 分配金 | 2.86% | 3.06% |
| 経費率 | 0.10% | 0.12% |
経費が安いのはVPUだけど、XLUもほとんど同じくらい
VPUの経費は0.10%。ものすごく安いね
さすが安さに定評のあるバンガードだよね。0.10%は安い!
ただし、XLUも経費率が0.12%と非常に安いですから、差はほんの少しだけです。
資産総額、流動性はXLUが圧倒的に大きいですね
資産総額と出来高は、XLUの方がかなり大きいよね。
出来高の差は、なんと85倍!!
機関投資家はXLUを運用しているからね。
流動性はXLUが圧勝だね
機関投資家レベルのすごく大きな資産を運用しているのならXLUがおすすめです。
でも普通の個人投資家なら、VPU程度の出来高があれば困ることはありませんよ。
配当は高いが、超高配当というほどではない
公益事業は高配当って言ってたけど、3%前後くらいなんだね
そうだね。超高配当ではないけど、十分に高配当だよ
配当が10%に迫る超高配当の銘柄はこちら


株価チャートでリターンを確認しよう!
ではリターンを確認しましょう。
わかりやすいように、S&P500のETF・SPYとの比較で見ていきます。
2021年初来ではS&P500を下回っています
まずは、2021年初来の株価チャートを確認しましょう
青:XLU 赤:VPU 黒:S&P500(SPY)
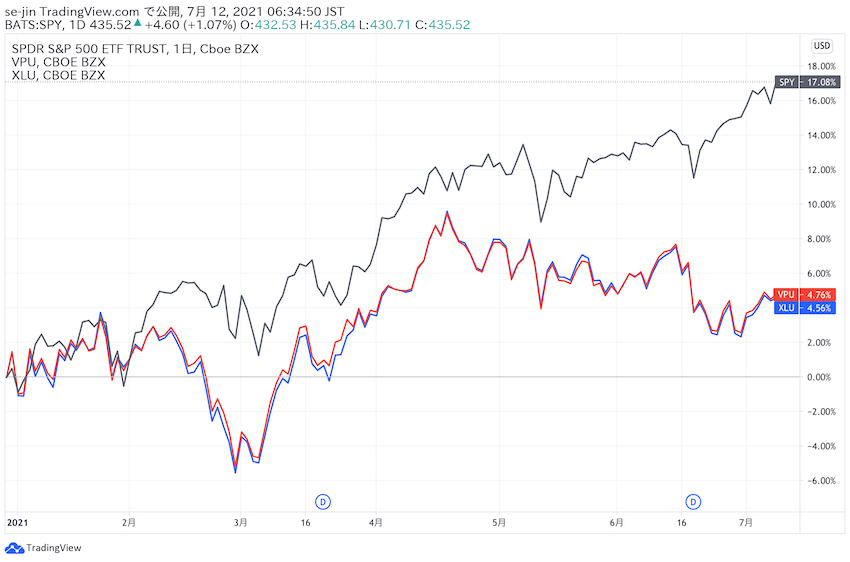
うーん、公益事業セクターはS&P500より下だね
年初来リターンはかなり差をつけられてるね。
安定感が特徴のセクターだから、S&P500みたいな半年で17%上昇するような爆発力は期待できないね。
XLUとVPUは、ほとんど同じような動きだね
2020年初来で見ると、コロナショックでのダメージは大きい
コロナショックを挟んだ、2020年初来の株価チャートを確認しよう!
青:XLU 赤:VPU 黒:S&P500(SPY)
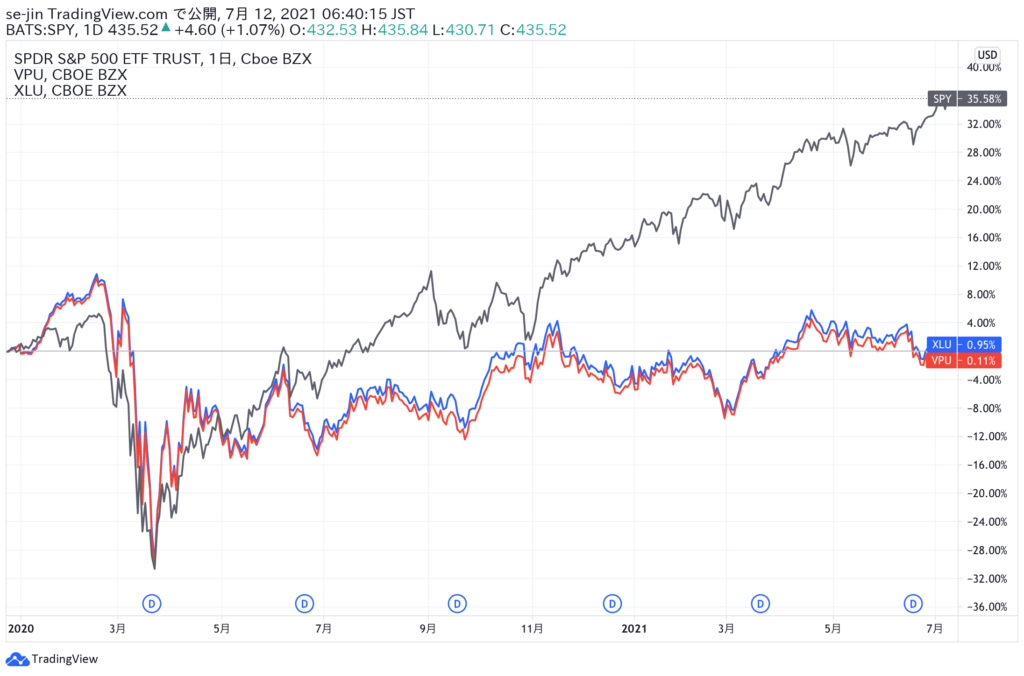
2020年初めから見ても、S&P500よりもかなり下なんだね
コロナショック前の高値には、いまだに回復してないね
不景気に強いはずなのに、コロナショックでは暴落してるし
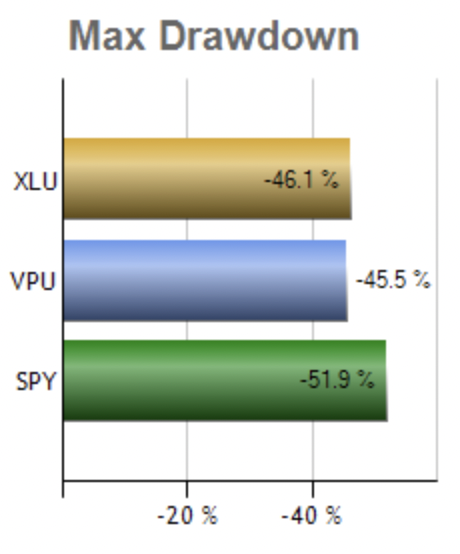
コロナショックでの下落幅を比較しよう
コロナショックでの落ち込みは、S&P500より大きくない?
コロナショックでの下落幅を見てみよう!
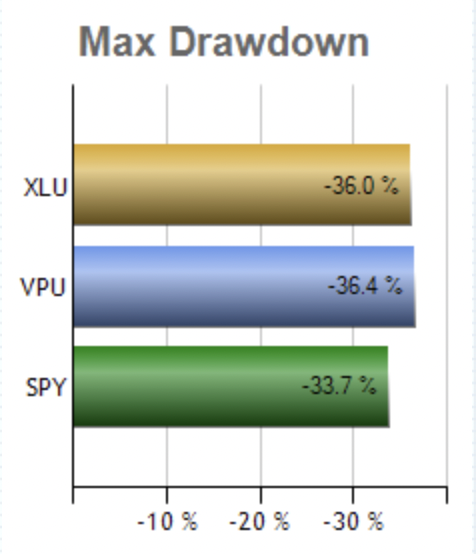
VPUもXLUも、S&P500より下落が大きいよ
リーマンショックでの下落幅を比較しよう
公益事業って、本当に不景気に強いのかな?
リーマンショックでの下落幅も見てみよう!
あ、リーマンショックの時はS&P500よりも下落が小さいね
S&P500よりも5〜6ポイントほど小さい下落だったね。

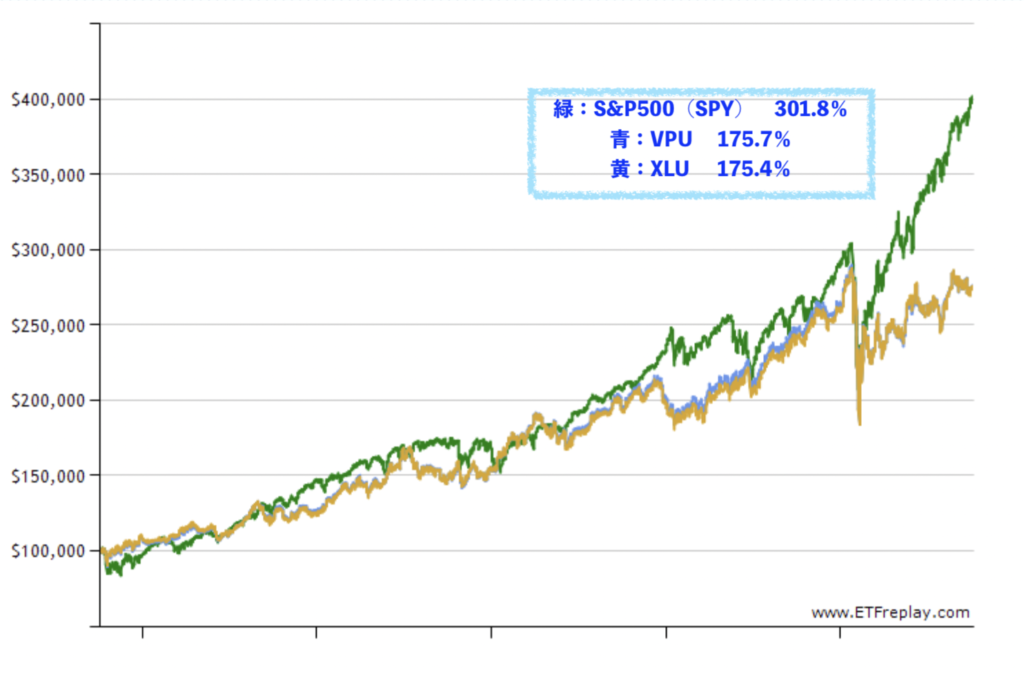
長期(17年間)リターンを確認しよう
長期リターンを確認しましょう。VPUが運用を開始した2004年1月からの17年ほどの株価チャートです。
青:XLU 赤:VPU 黒:S&P500(SPY)
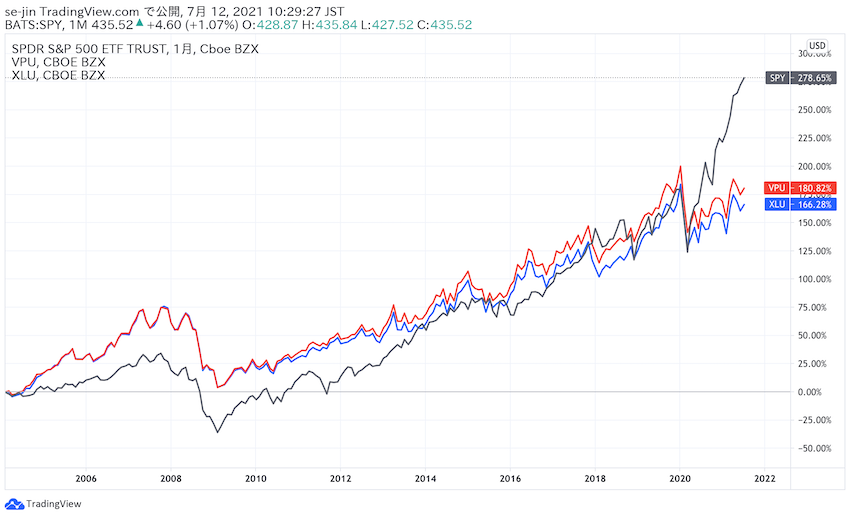
あちゃー!長期で見ても、やっぱり公益セクターはS&P500より下だね
そうなんだけど、注目して欲しいのは前半部分だよ
2004年から2017年くらいまでは、公益セクターの方が上に行ってるね!
2004年から2010年ごろは、米国株が非常に弱い時期でした。
この時期に強さを見せた公益事業セクター、やはり不景気には強さを見せるようですね。
2010年代はグロースおよび米国株が非常に強い10年間でした。
世界でも圧倒的な成長を見せる米国市場にさえ投資していればいい10年間でしたね。
しかし、そのまえの2000年代は、米国株が停滞する低成長の10年間だったのです。
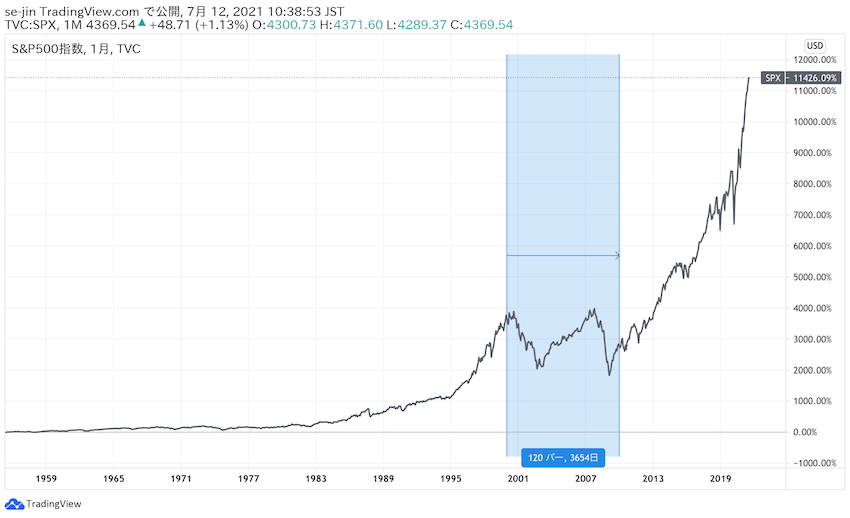

ええ!10年間トータルでマイナスリターン!?
さらにその前の1990年代は、やはり米国株が強い時代でした。
2000年代の値動きをピックアップ!
米国の株式市場が長期間停滞していた、2000年〜2010年の10年間のチャートを確認しましょう。
VPUは2000年時点では運用を開始していないので、XLUとSPYの2銘柄を比較します。
青:XLU 黒:S&P500(SPY)
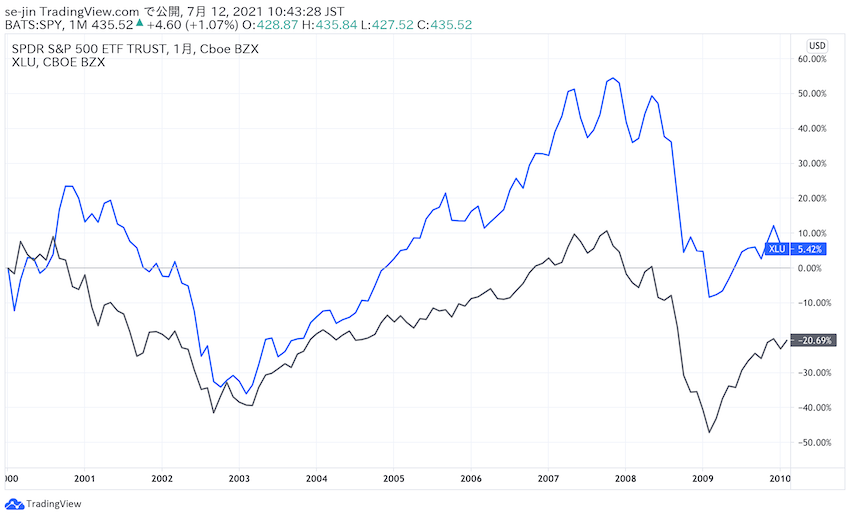
S&P500が長期でマイナスリターンなのに、
公益事業はしっかり利益を出してるね!

構成銘柄を比較しよう
VPUとXLUは同じような値動きだったけど、構成銘柄はどう違うのかな?
大型株のみのXLU、中小型株を含むVPU
構成銘柄数を比較しましょう。
セクターETFは、いつもバンガードの方がよく分散されてるよね
元になる指数が違うからね
- VPU
-
ユーティリティ・セレクト・セクター指数
S&P500の中の公益事業セクター銘柄を集めたETF
- XLU
-
MSCI USインベスタブル・マーケット・ユーティリティーズ指数
米国全体の公益事業セクター銘柄を集めたETF
わかりやすく言えば、大企業のみのXLUと、中小企業も含むVPUってこと
構成銘柄の上位10銘柄は、順位は違うが同じ銘柄
大企業のみのXLUと、中小を含むVPU、構成銘柄の上位10銘柄を比較しましょう。
10位以外は、全く同じだね!
ほんとだね。違いと言えば、
構成銘柄の少ないXLUの方が上位銘柄の構成比が大きい
VPUのほうが、よく分散されています
分散性を比較してみましょう
分散性に関する項目を抜き出すと、このようになります。
| XLU | VPU | |
|---|---|---|
| 構成銘柄数 | 29銘柄 | 67銘柄 |
| 上位10銘柄の割合 | 63.45% | 54.56% |
| 上位3銘柄の割合 | 31.96% | 27.26% |
VPUはXLUの2倍以上の銘柄に分散しています。
上位10銘柄の占める割合、上位3銘柄の占める割合を見ても、
VPUの方が低く抑えられており、より分散性が高いことを示してます。
とは言っても、他のセクターに比べると差は小さいですね。公益事業の中小型銘柄は、あまり多くはないのでしょう

配当金を確認しましょう
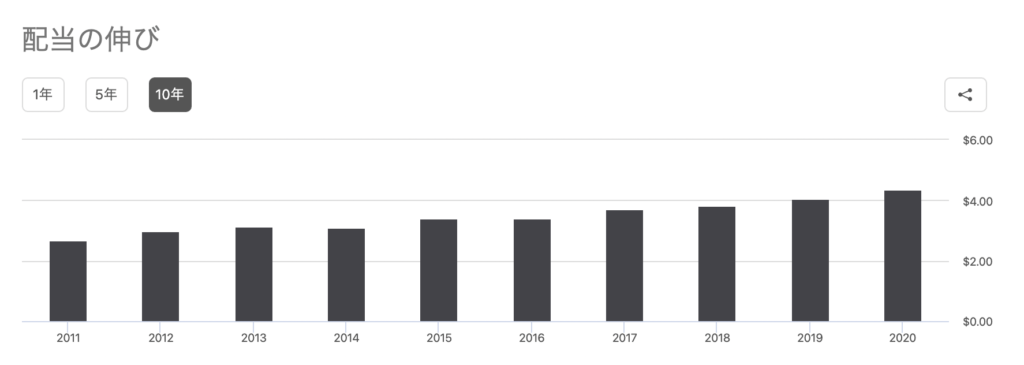
VPUの10年間の配当状況はこちら
XLUの10年間の配当状況はこちら
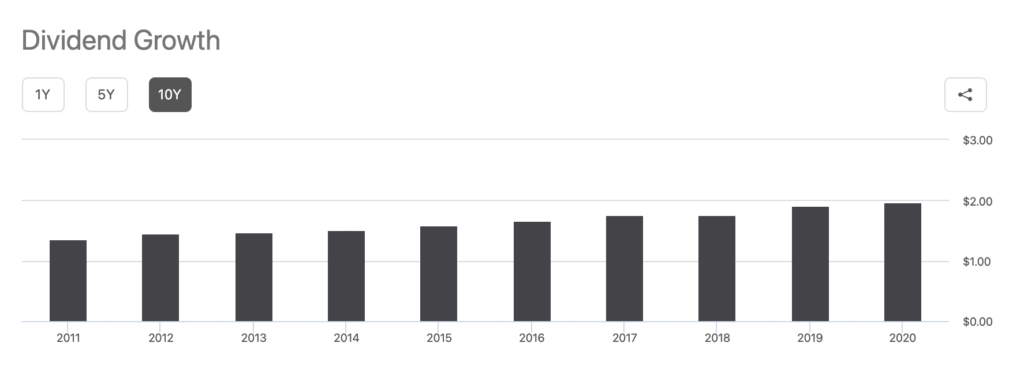
両方とも、だいたい右肩上がりの配当金だね
ほとんど減配してないみたいだね。増配銘柄として期待できそう
VPUの詳しいデータはこちら
| 年 | 配当額 | 年末利回り | 増配率 |
|---|---|---|---|
| 2020 | $4.3488 | 3.21% | 7.72% |
| 2019 | $4.0373 | 2.96% | 6.06% |
| 2018 | $3.8067 | 3.49% | 2.68% |
| 2017 | $3.7074 | 3.55% | 8.63% |
| 2016 | $3.4130 | 3.67% | -0.03% |
| 2015 | $3.4140 | 4.32% | 10.52% |
| 2014 | $3.0890 | 3.72% | -1.37% |
| 2013 | $3.1320 | 4.79% | 4.50% |
| 2012 | $2.9970 | 5.26% | 12.71% |
| 2011 | $2.6590 | 4.76% | 4.69% |
XLUのデータはこちらです。
| 年 | 配当額 | 年末利回り | 増配率 |
|---|---|---|---|
| 2020 | $1.9701 | 3.19% | 3.20% |
| 2019 | $1.9090 | 3.11% | 8.40% |
| 2018 | $1.7611 | 3.61% | 0.49% |
| 2017 | $1.7525 | 3.73% | 5.67% |
| 2016 | $1.6584 | 3.96% | 4.32% |
| 2015 | $1.5897 | 4.40% | 5.55% |
| 2014 | $1.5061 | 3.97% | 2.77% |
| 2013 | $1.4654 | 4.97% | 1.36% |
| 2012 | $1.4458 | 5.54% | 5.89% |
| 2011 | $1.3653 | 5.29% | 8.50% |
VPUは2014年と2016年に減配してるけど、ほんのわずかだね。XLUは減配してないよ!
この10年間で配当額は、VPUは1.6倍、XLUは1.4倍くらいになってるね。
配当利回りは1〜2%程度なのですが、ほぼ毎年着実に増配しています。
配当利回りは、0.1〜0.3%程度XLUのほうが高いことが多いですね。
直近10年間の配当込みトータルリターンを比較すると、
VPUとXLUは、驚くほど似たようなリターンだね!

まとめ
公益事業セクターとは
電気、ガス、水道など、ライフラインと言われるような生きていくのに欠かすことのできない事業を手がけるセクターです。
不景気に強く、2000年代の10年間はS&P500をアウトパフォームしていた
好景気のときは、S&P500よりも伸びが小さい
金融危機などの時は、それなりに下落する
それなりに高配当
毎年しっかり増配する
などの特徴があります。
今後、米国市場が停滞期になると想定するのであれば、そのヘッジとして持っておいてもいいかもしれませんね。
公益事業セクターETF、VPUとXLU
公益事業セクターのETFには、VPUとXLUがあります。
VPUとXLUの違いは、
XLUは大型株のみ、VPUは中小型株も含むこと
この違いによるリターンの差はありません。
驚くほど同じようなリターンです
これは、公益事業セクターの中小型株がセクター全体に与える影響が小さすぎるためでしょう。
配当金は、超高配当ではありませんが毎年しっかりと増配しています。
配当額は両者とも10年間で1.4から1.6倍になっていて、長期で保有すれば高配当株になるかも。
公益事業セクターETFの選び方
最後に、せーじんの考える公益セクターETFの選び方を紹介したいと思います。
機関投資家のような大規模な資産を運用しており、非常に高い流動性を重要視している
⇨資産総額と出来高が圧倒的に高いXLUがおすすめ
分散性を重視し、少しでも多くの銘柄へ投資したい
⇨わずかだが経費が安く、分散が効いていてリターンも優れているVPUがおすすめ
これ以外の方は、正直どちらでもかまいません。同じです。
\ 口座開設無料 /
仕事に、育児に、遊びに忙しいサラリーマンの資産形成には、CFDという選択肢も有力です。
CFDの取引時間はほぼ24時間。
夕食後のゆっくりした時間や通勤の電車の中、祝日でも取引することができます。
またレバレッジをかけた投資をすることもできますから、
少ない資金からから大きな利益を狙うこともできます。
詳しくはこちらの記事をご覧ください。


DMMFX
業界最狭水準のスプレッドで取引手数料は0円!せーじんのポートフォリオ
せーじんの資産状況と取引履歴を、毎月初めに報告しています。

4月から、S&P500のETF、レバレッジ投資信託、CFDのリターン比較実験をしています。こちらも毎月経過を報告していますので、ぜひご覧ください。

以上【VPU・XLU】公益事業セクターは不景気に強く、着実な増配が魅力!という話題でした。
本日も最後までお読みいただきありがとうございました。

ワードプレステーマ「swell」
簡単、手軽、短時間で記事を執筆できるテーマとして有名なSWELL
装飾やプログラムの勉強時間を大幅に短縮でき、記事を書くことに集中できます。
こんなことができるのは、ワードプレスの新機能ブロックエディターに対応しているから!
レンタルサーバー「conohawing」
早い、安い、優しい
と3拍子揃ったレンタルサーバー。
表示速度の速さはgoogleからの評価対象であり、googleから評価されればアクセス数の上昇が期待できます。
安さも業界トップクラスです。
初心者でも操作しやすい管理画面にも定評があります。