
こんにちは、せーじんです。

米国の株式指数の上昇が止まらないね。

へえ、そうなの?
S&P500もNASDAQ総合も最高値更新だってさ
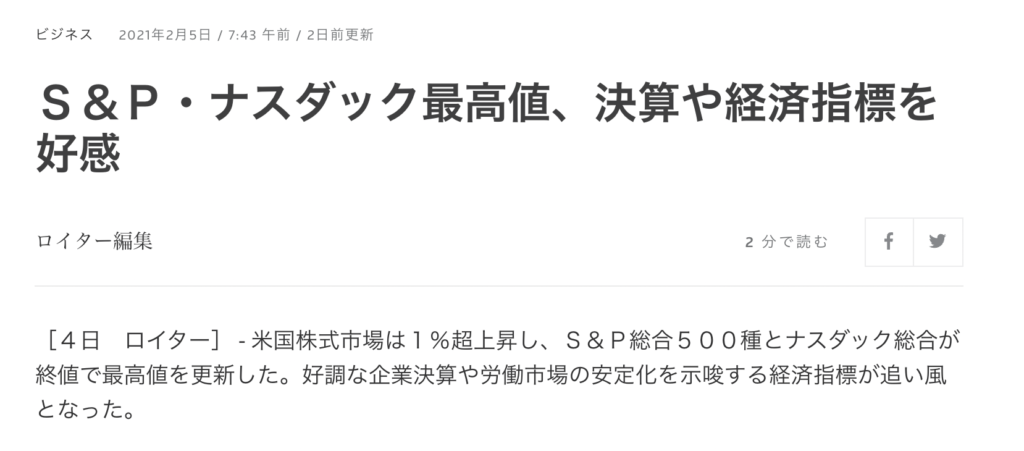

最高値更新ということは、手数料などを無視すれば、損をしている人が誰もいないということ。
参加者全員が勝てるゲームなんて最高だよね
報道記事にはナスダック総合しか触れられていませんが、ナスダック100もナスダック50も最高値を更新しています。

ナスダックの各指数のチャートを確認しましょう
ナスダックの各指数のチャートを確認しましょう。
年初来チャートでは、全ての指数が最高値を更新したことがわかります
まずは2021年の年初来チャートです。
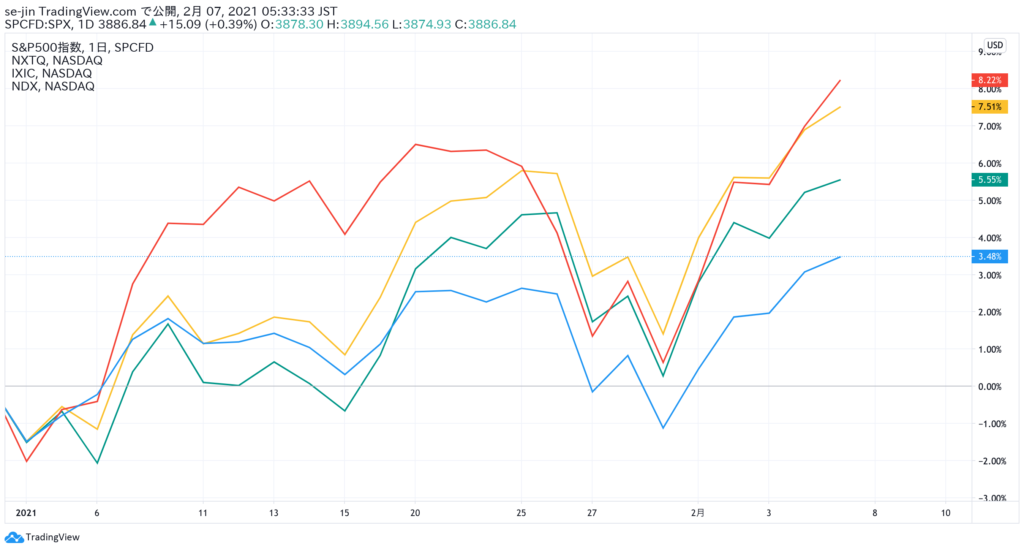
2月5日も引き続き上昇しており、株式市場に力強さを感じます。
1年間のチャート、コロナ後は上がり続けています
続いて、2020年2月からの1年間のチャートです。

コロナショック後は、ずっと上がっているね
そうだね。特にS&P500よりもナスダックの上がり方が大きいね。
それはどうしてなの?
コロナの感染拡大対策のために、世界中でロックダウンが行われたり、テレワークが進んだりしたよね。
ああ、そうか。
ナスダックはハイテク企業の割合が大きいから、コロナが追い風になったんだね。
そのとおり!
5年間のチャート、右肩上がりの傾向が強い
最後に、2016年2月からの5年間のチャートを確認します。
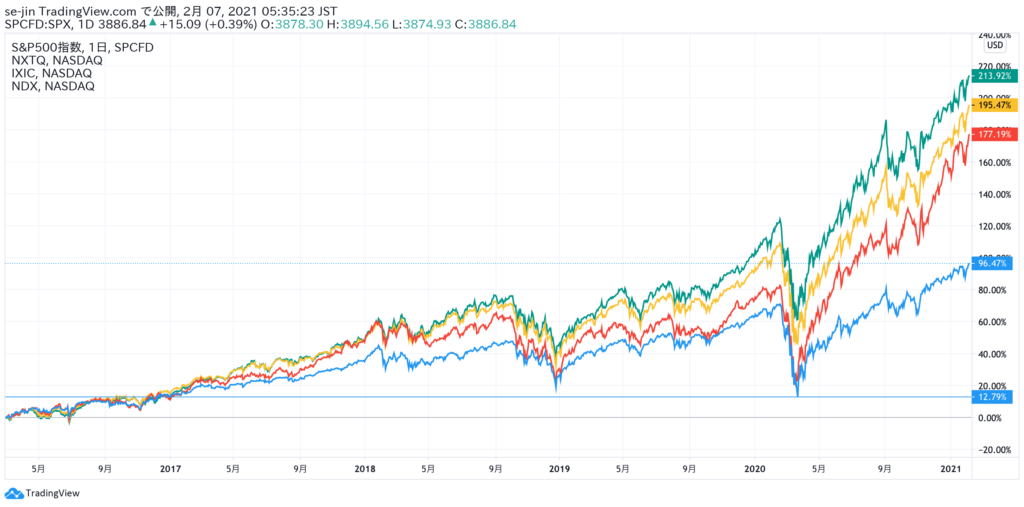
ずーっと右肩上がりが続いているんだね
そう。これが米国株インデックス投資の醍醐味だよ。
ナスダックやS&P500などの米国インデックスは、長期で持ち続ければ誰でも資産を増やすことができるのです。
この資産形成で最も大きな敵は、狼狽売り。
狼狽売りとは、株価が下がったときに、含み損に耐えきれずに売ってしまうことです。
これをやってしまうと資産は減るばかりですよ!
長期的な資産形成については、こちらの記事でまとめましたので、ぜひご覧ください。

ナスダック、今年も上がる?上がる!
ナスダックは、今年も上がるのかなあ
うん。今年も上がると思うよ。
今年も上がる理由1 長期トレンドは上、指数は上がるようにできている
超長期のチャートを確認しましょう。
1977年から43年間のチャートだよ。
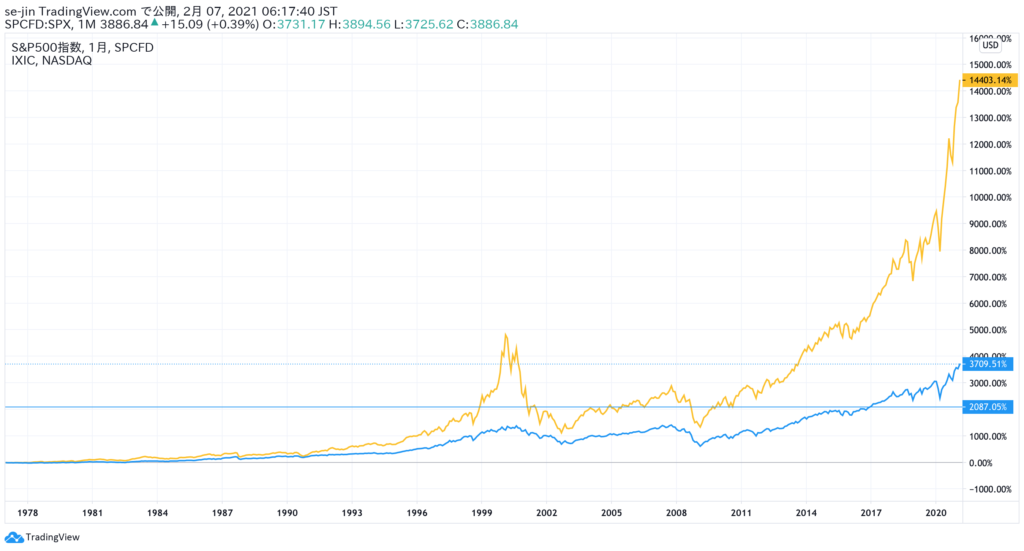
うわー、超長期で見ても上がり続けてるね
でしょ?基本的には、米国のインデックスは上がるようにできているんだよ
ナスダック50も100も、S&P500も、一定期間ごとに構成銘柄の入れ替えを行っています。
成長が止まった銘柄を排除し、成長著しい銘柄を入れることで、指数は上昇し続けるのです。
米国の指数が上がるようにできていることについて、こちらにまとめましたのでぜひご覧ください。

上がる理由2 現在の株価はバブルではない
でも、このチャートで一つ気になるところがあるんだよね。
2000年の大きな山でしょ?やっぱり気になるよね
そりゃ気になるでしょ。ナスダックなんて、下落後にもう一度この高値を越えたのは14年後だよ。
でもね、せーじんは心配いらないと考えているよ。2000年と現在では、状況が全く違うからね
2021年2月(現在)と、2000年のテックバブル崩壊時との違い
- FRBの政策金利が低い
- 大規模な量的緩和が行われている
- 株高ではあるが実体経済は不景気である
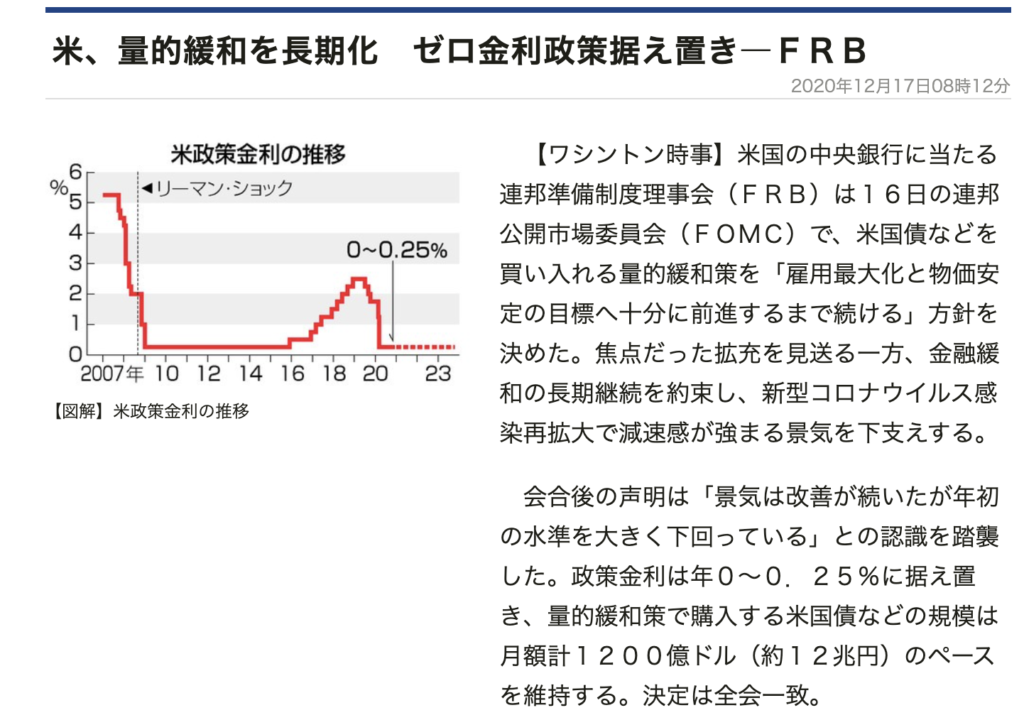
FRBの政策金利が低い
2021年2月現在、米国連邦準備制度理事会(FRB)は、政策金利をゼロとするゼロ金利政策を実施しています。
これは米国史上初めての出来事です。
2000年当時は政策金利が6%を越えていましたから、0金利の現在とは大きな隔たりがあります。
金利と株価には、
という相関があります。
なんでこうなるの?
この関係を超簡単に説明すると、こうです。
金利が下がる⇨お金を借りやすくなる⇨事業を拡大する⇨業績が上がる⇨株価が上がる
FRBは、このゼロ金利政策を2023年末まで継続すると発表しています

大規模な量的緩和が行われている
FRBは、米国債などを月額1200億ドル(約12.6兆円)もの規模で買い入れています。
これは、市場に流通する通貨を増やし、景気や株価を下支えする効果を狙う量的緩和という政策です。
これも米国史上初めての政策です。
当然、2000年当時には行われていませんでした。

株高ではあるが実体経済は不景気である
FRBがゼロ金利政策や量的緩和を実施している理由は、コロナ禍における不景気への対策です。
コロナ禍ではハイテク企業などに恩恵をもたらす一方、飲食やエンターテイメントなどに破滅的なダメージを与えています。
そのためFRBは、新型コロナウイルス感染症が収束するまでは、こういった政策を維持するものを思われます。
一方、2000年当時の米国は好景気に沸いており、多くの業種がその恩恵を受けていました。
景気が回復し、金融緩和政策を見直すときに注意が必要
現在の米国経済は、不景気にもかかわらず、FRBの景気刺激策によって株価が釣り上がっている状況です。
好景気だった2000年とは状況が異なりますから、現在はバブルであるとは言えません。
FRBの動きには、注意を払う必要がありますね。

上がる理由3 大統領選挙翌年のアノマリー
大統領選挙とその翌年は、株価がよく上昇するというアノマリーがあります。
アノマリーとは、論理的な説明はできないけど、そうなることが多いという経験則です。
米国大統領選挙と株価についてのアノマリーも多くあります。
その中でも、確率が高いアノマリーとして知られるのが、
というものです。
大統領選挙は2020年に行われましたから、2021年の今年は上昇するということになりますね。
大統領選挙翌年は、直近10回のうち8回は値上がりしていますよ
なかなかの確率だね
大統領選挙に関するアノマリーはこちら

そして、民主党の大統領の場合、より大きく株価が上昇するアノマリーもあります。
2021年、期待できますよ!
大統領選挙に関するアノマリーはこちらにも詳しく掲載しています。

まとめ
ということで、最高値を更新したナスダック50やナスダック100が今後も上がり続けるのか見てきました。
2000年のテックバブル崩壊のように、今回もバブル崩壊になるのでしょうか。
せーじんは、今後も上がり続けると考えています。
2000年とは状況が全く異なるからです。
上がり続ける理由は、
- 長期トレンドは上、指数は上がるようにできている
- FRBの政策金利が低い
- 大規模な量的緩和が行われている
- 大統領選挙翌年は株価が上昇するアノマリー
しかも民主党大統領の場合さらに大きく上がるアノマリーもあります。
現在は、株高ではありますが実体経済は不景気です。
景気が回復し、金融緩和政策を見直すときに株価の大幅な下落がある可能性がありますから注意が必要です。

以上、ナスダック50、ナスダック100ともに最高値更新!どこまで上がる?という話題でした。
本日も最後までご覧いただきありがとうございました。
